Nearly 5,500 people died as a result of workplace injuries in the United States in 2022 — meaning someone died on the job every 96 minutes, according to data from the Bureau of Labor Statistics.
That’s also the highest level since 2007, when workplace deaths fell by 20% in two years as the 2008 financial crisis and subsequent recession slowed down the manufacturing and construction industries, two of the most hazardous sectors of the U.S. economy.
But after another decrease in deaths during the early years of the COVID-19 pandemic, workplace fatalities are on the rise again — up 5.7% from 2021.
Workers are still much safer than they were in previous decades, thanks in part to the Occupational Safety and Health Act of 1970, which established the first national collection of data on workplace injuries (information on fatal injuries was not collected until 1992). The data collected allowed regulators to implement policies designed to keep workers safe on the job regardless of industry.
Still, it is undeniable that some jobs carry more inherent risks than others. To figure out which jobs are the deadliest in the 2020s, we used BLS’s 2022 Census of Fatal Occupational Injuries to identify the 10 occupations with the highest rates of fatal injury.
Fatal injury rates are determined by measuring the number of workplace deaths per 100,000 “full-time worker equivalents,” which controls for the fact that different jobs have different schedules by looking at the total number of hours worked in an occupation and dividing by 200,000,000 — the number of hours that would be worked by 100,000 workers on standard 40-hour schedules with two weeks off per year.
That means that the total number of workplace deaths for an occupation can be significantly larger or smaller than the fatality rate, depending on the total number of hours worked. It also means that there tends to be wider year-to-year variance in fatality rates in less common occupations.
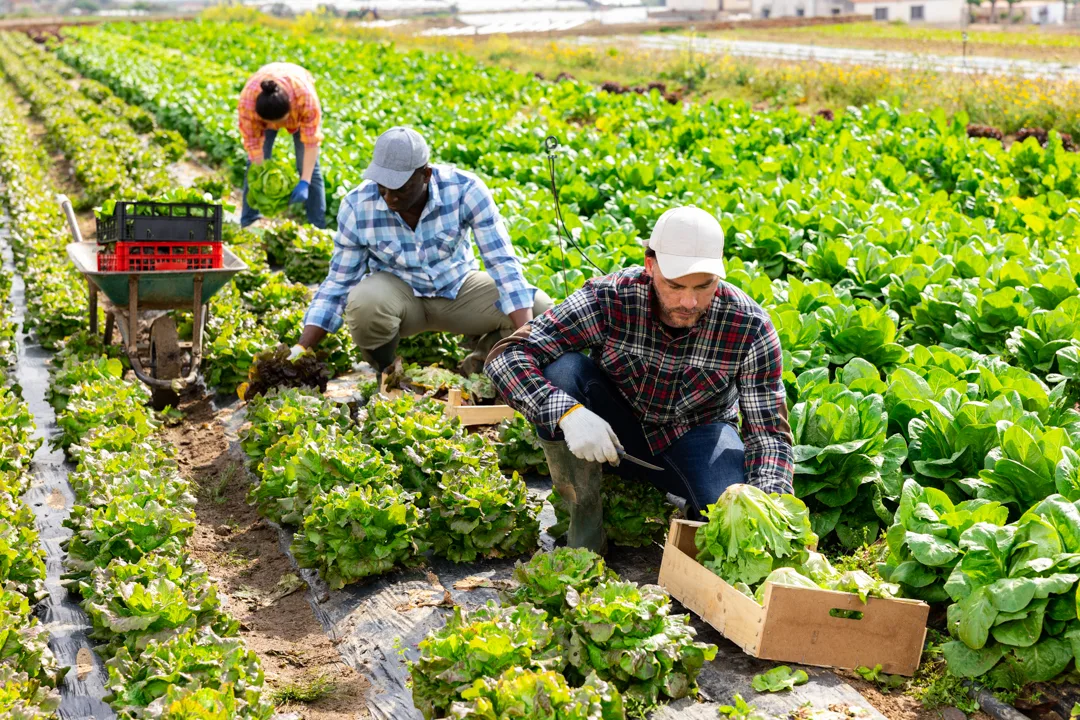
#10. Miscellaneous agricultural workers
- 20 fatalities per 100,000 full-time equivalent workers
- Fatality rate up 22% compared to 2017
- Total fatal work injuries in 2022: 146
Agricultural workers face one of the widest arrays of on-the-job hazards of any occupation. They work with heavy-duty equipment, are exposed to potentially dangerous chemicals in fertilizers and pesticides, and sometimes deal with large animals.
 Salt Cave Workers
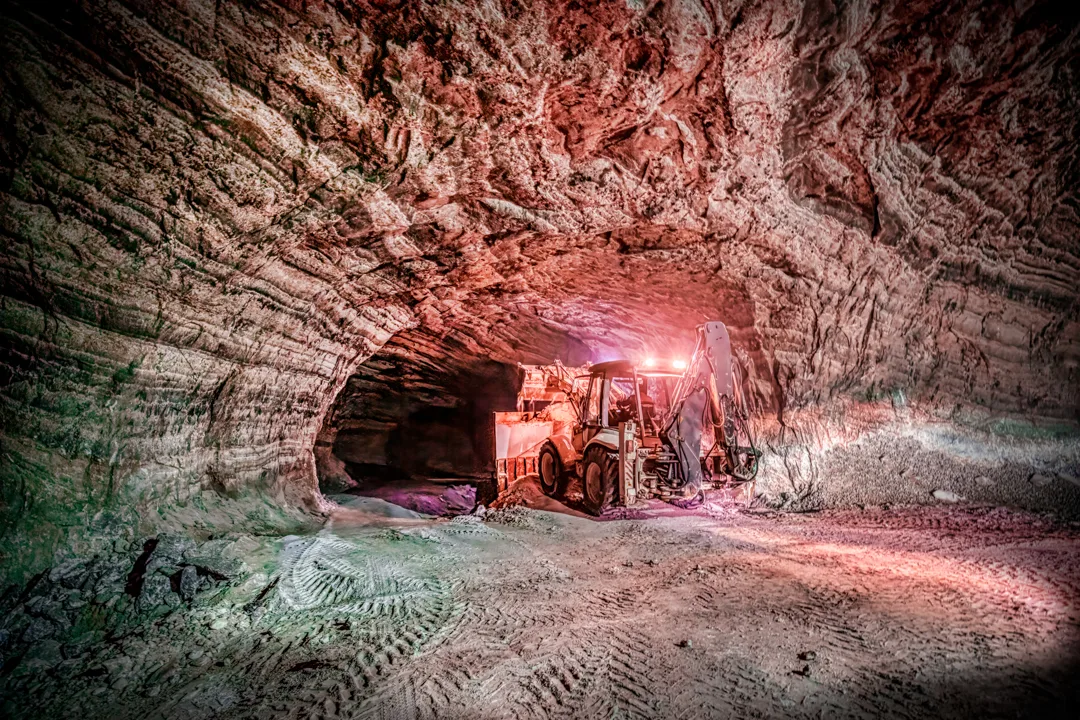
#9. Underground mining machine operators
- 20.1 fatalities per 100,000 full-time equivalent workers
- Fatality rate up 72% compared to 2017
- Total fatal work injuries in 2022: 8
The underground mining occupation is relatively small, which is how the job can end up on a list of dangerous occupations despite only having eight fatalities in a year. But there are many risks on an underground job site; in addition to the direct risk of operating heavy-duty mining equipment, these workers also face the possibility of cave collapses and underground explosions.
Construction and Steel Workers
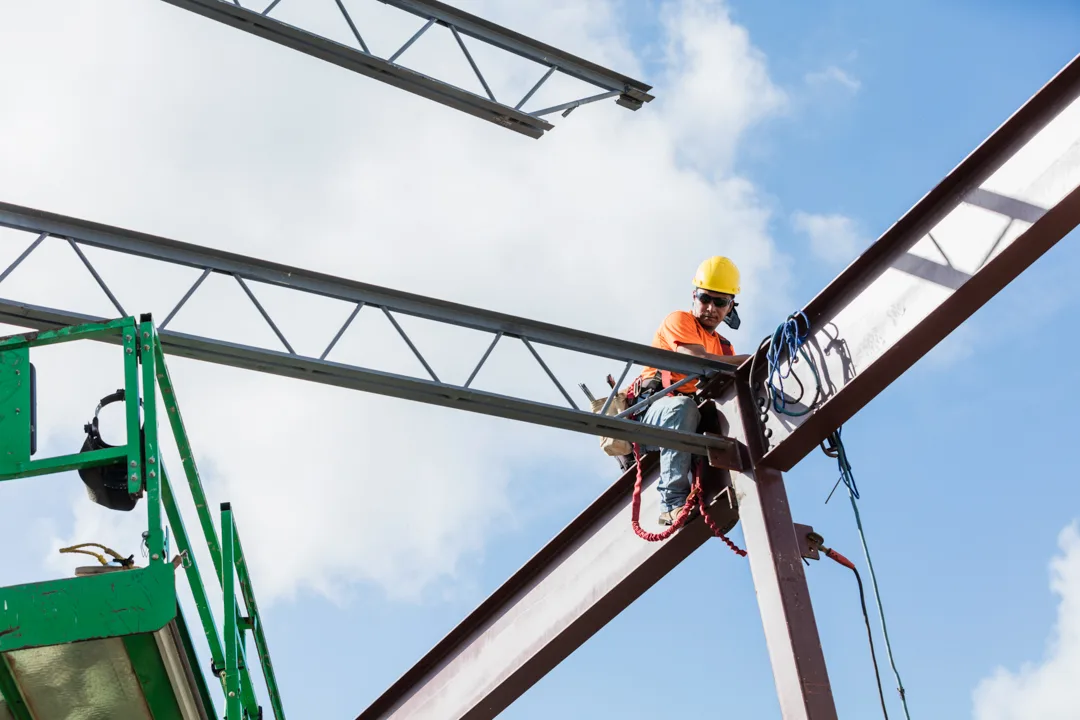
#8. Structural iron and steel workers
- 21.3 fatalities per 100,000 full-time equivalent workers
- Fatality rate down 36% compared to 2017
- Total fatal work injuries in 2022: 14
You’ve seen the classic picture of workers enjoying their lunch while sitting atop a skyscraper beam, many stories above New York City. But the workers who construct the frameworks of skyscrapers and other buildings don’t just head up to high beams when it’s time for a midday meal; they spend their days in the air, which is why about two-thirds of their workplace deaths are related to falls.
Waste Management Workers
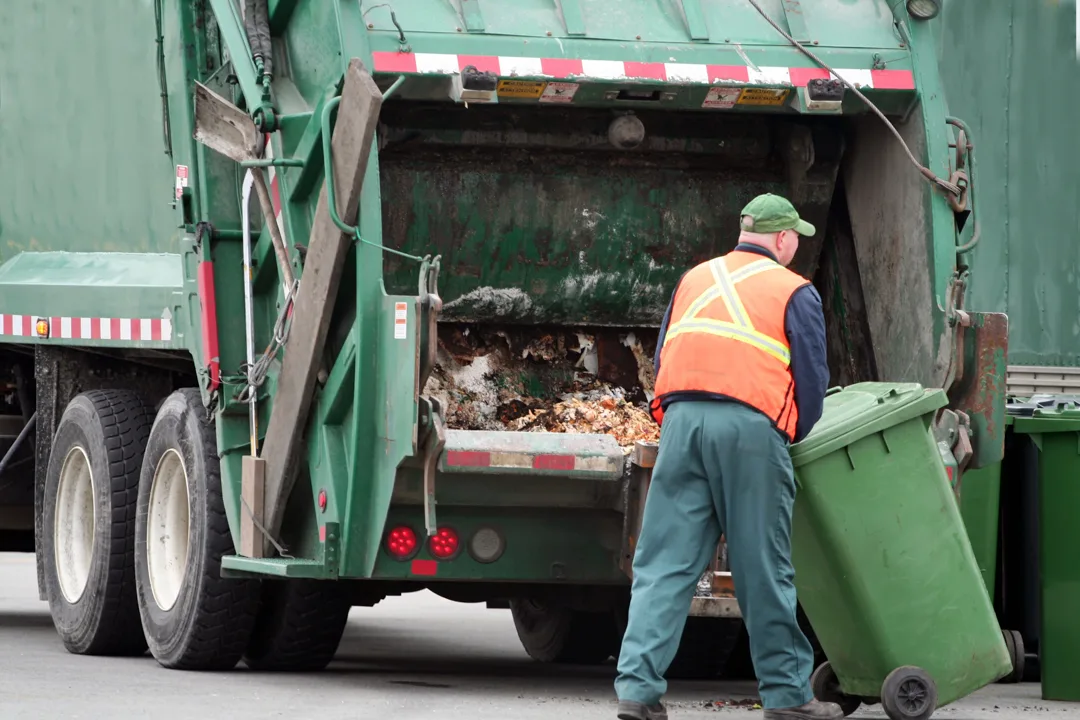
#7. Refuse and recyclable material collectors
- 22.6 fatalities per 100,000 full-time equivalent workers
- Fatality rate down 35% compared to 2017
- Total fatal work injuries in 2022: 22
Waste collectors are most commonly killed in transportation incidents, a category that includes motor vehicle crashes, collectors being hit by their trucks, or falls from moving vehicles.
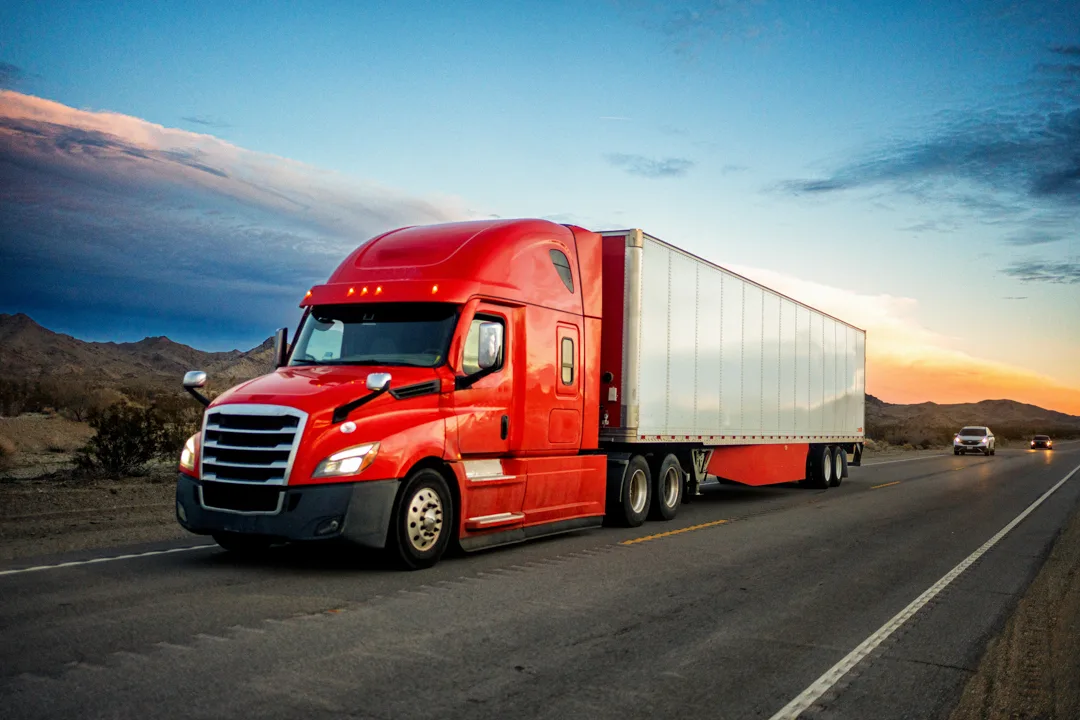
Driver and Truck Workers
#6. Driver/sales workers and truck drivers
- 30.4 fatalities per 100,000 full-time equivalent workers
- Fatality rate up 13% compared to 2017
- Total fatal work injuries in 2022: 1,115
No single occupation had more fatal injuries on the job than truck drivers, who made up 20% of total workplace deaths. 4 in 5 of those deaths were attributed to transportation incidents, more than double the national average.

Airplane and Aircraft Pilots
#5. Aircraft pilots and flight engineers
- 35.9 fatalities per 100,000 full-time equivalent workers
- Fatality rate down 26% compared to 2017
- Total fatal work injuries in 2022: 72
Almost every workplace death in this sector was attributed to a transportation incident. About three-quarters of the people who died on the job were commercial pilots.
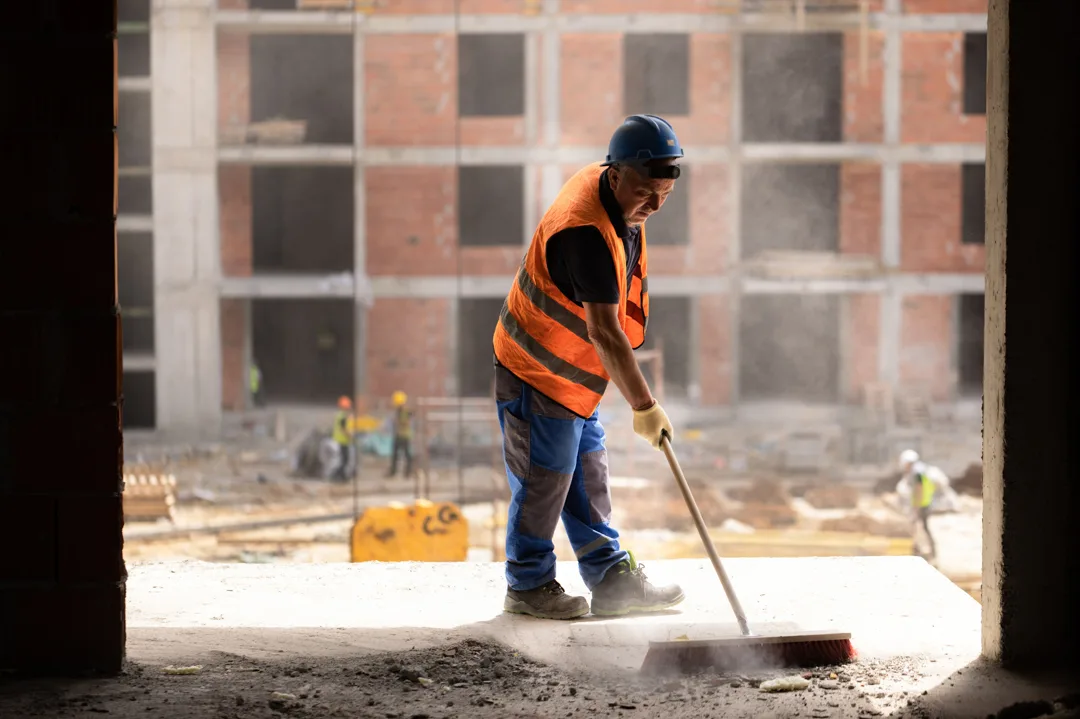
Construction Trade Workers
#4. Helpers, construction trades
- 38.5 fatalities per 100,000 full-time equivalent workers
- Fatality rate up 145% compared to 2017
- Total fatal work injuries in 2022: 20
No occupation has had a bigger spike in fatality rate since 2017 than construction helpers, who clean and prepare job sites, help set up equipment, and dispose of waste, among other tasks. Falls, slips, and trips and exposure to harmful materials are the most common causes of death.
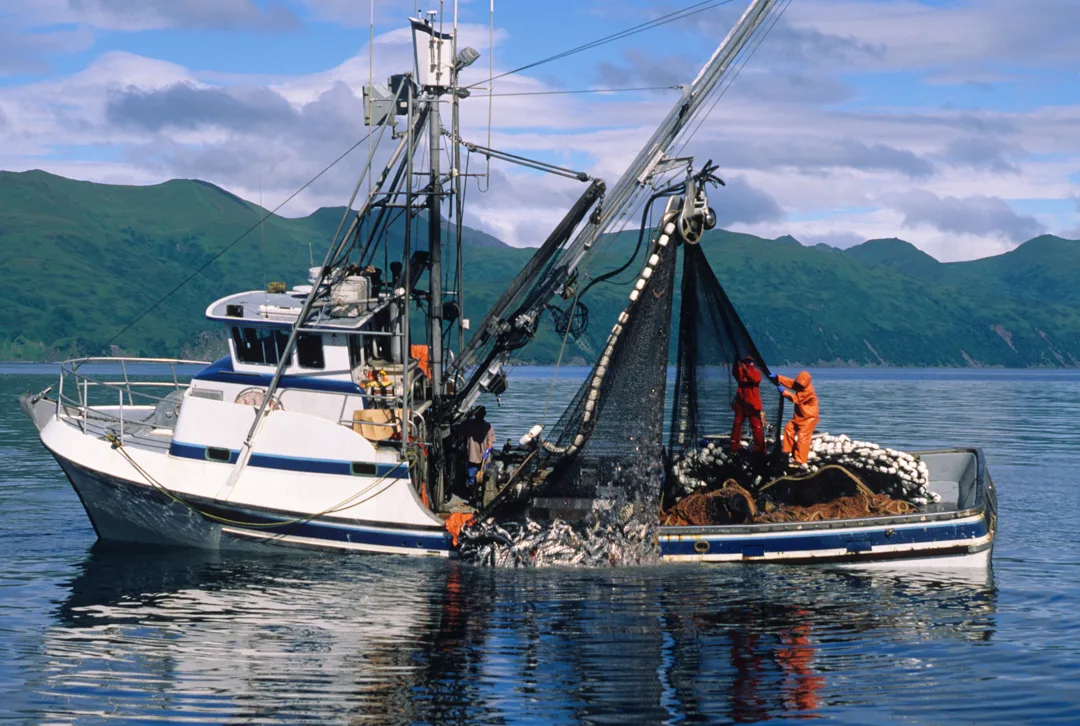
Fishing and Hunting Workers
#3. Fishing and hunting workers
- 50.9 fatalities per 100,000 full-time equivalent workers
- Fatality rate down 35% compared to 2017
- Total fatal work injuries in 2022: 16
The most dangerous job in America in 2020, commercial fishers and hunters often face brutal working conditions without easy access to medical care. As of 2020, 30% of commercial fishing fatalities involved a worker falling overboard from a ship.
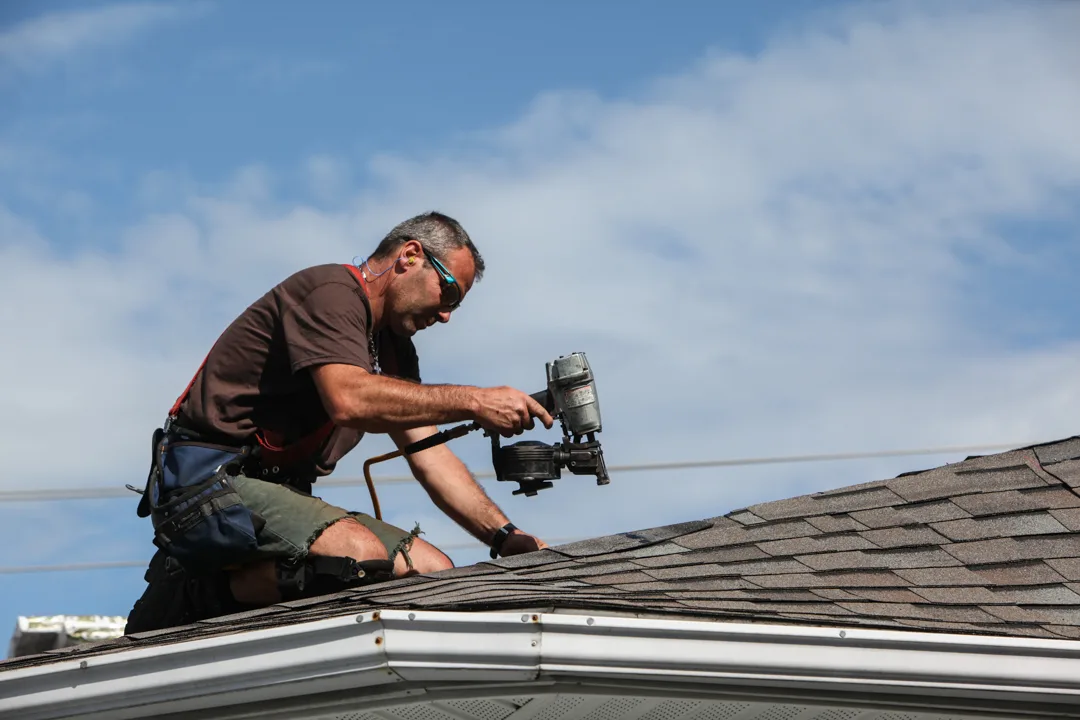
Roofers
#2. Roofers
- 57.5 fatalities per 100,000 full-time equivalent workers
- Fatality rate up 27% compared to 2017
- Total fatal work injuries in 2022: 105
The profession with the highest fatal accident rate in the construction industry, roofers face numerous hazards on the job. Most roofing deaths, about 90%, involve workers falling, either directly from a roof or off of a ladder. But they also face environmental risk from working outside and being exposed to the sun on hot days, which can lead to heat exhaustion or heat stroke.
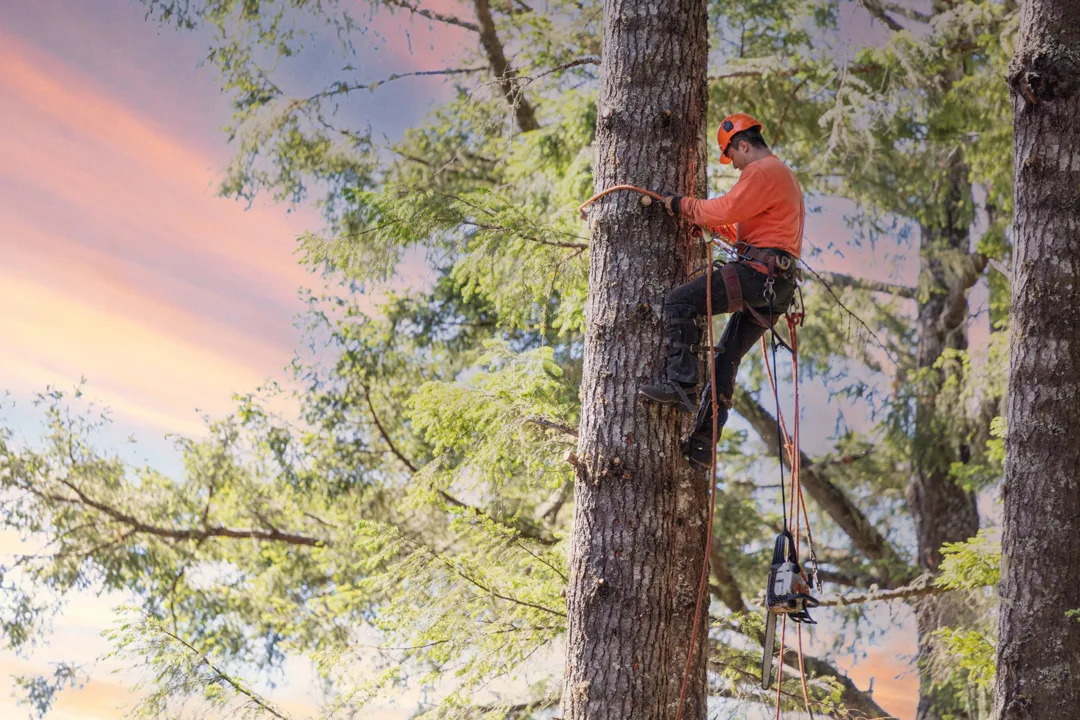
Logging Workers
#1. Logging workers
- 100.7 fatalities per 100,000 full-time equivalent workers
- Fatality rate up 19% compared to 2017
- Total fatal work injuries in 2022: 54
Approximately 80% of fatal logging injuries involve “contact with objects or equipment,” according to the BLS data. With logs that can weigh thousands of pounds, tools designed to cut through such giant logs, and jobs that require climbing to high heights in order to cut off branches, loggers are surrounded by potential hazards all the time.
Data sources and methodology
Data for this analysis comes from the Bureau of Labor Statistics, which collects data annually for the Census of Fatal Occupational Injuries (2022 is the most recent year with publicly available data).
The BLS groups workers by industry and occupation, then measures the total fatality rate by dividing the number of workplace fatalities by the total hours worked in an industry and multiplying by 200,000,000 to determine the number of deaths per 100,000 full-time worker equivalents.
We compared the 2022 fatality rates by occupation to 2017 to examine how injury rates had changed over the past five years and where they were in comparison to pre-COVID-19 pandemic levels.